
Let’s Talk: The Other Side of the Funding Coin — Exits
In previous ‘LET'S TALK’ features, we’ve been discussing funding levels. Let’s switch that and talk about the other side of the coin: Exits.
Specifically, where the next round for a company is an Exit via a merger and acquisition (M&A) or a public listing. Given our funding focus at Columbia Lake Partners on funding fast-growing technology companies, we wanted to look for changes in that sector.
Join our managing partner, Craig Netterfield, as he discusses our findings.
-------------------------------------------------------
“ We found that the ten-year period from 2013-22 was one of two distinct periods. Later years showed a significant increase in VC Early Stage M&A Exit, a decrease in later stage M&A activity and an increase in later stage IPOs. The value of IPOs vs M&A is significant and has grown. From 2013-19, an IPO was, on average, worth 6x an M&A exit. From 2023-22, this grew to nearly 14X. When the IPO window opens again, we should be seeing both good quality and quantity of public listings. ”
-------------------------------------------------------
Let’s look at Exits via M&A’s first
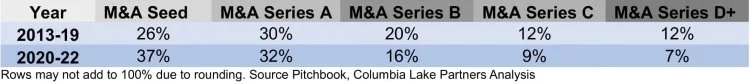
Table 1 below shows us that of all exits via M&A in 2013, 25% had raised only a seed round, while 12% raised a Series D (or later) round. In 2022, the number of companies exiting via M&A having raised only a seed round grew to 41% while those that raised through to a Series D (or later) round dropped to 6%.
Table 1:

From the above, we noticed the ten-year period was a market of two halves: 2013-19 vs 2020-22.
Seed companies in 2020-22 sold more frequently than in 2013-19. We placed those primarily as acquihire sales.
In contrast, for Series B, C and D+ with a trend decline in the volume of exits to M&A as a % of overall volume declined 2020-22 vs 2013-19.
Table 2 below summarises these two periods:
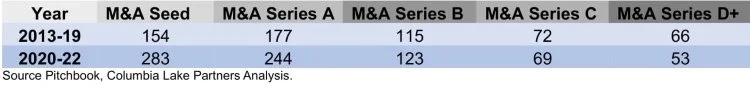
The annual volume of exits (see table 3 below) was 33% higher in the 2020-22 years (154 average /year) vs 2013-19 (116 average /year):
The volume of Seed stage company exits nearly doubled over this period. Series A stage companies also saw a substantial increase in Exits through M&A with volumes increased by nearly 40%.
The later stage Series C and Series D+ companies had fewer exits to M&A in the 2020-22 period.
Table 3:
The IPO window opened in 2020-22
As shown in Table 4 below, exits to IPO for series C and D+ companies grew sharply in 2020-22 vs 2013-19.
Table 4:
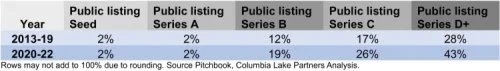
Series B stage companies also saw an increase in listing activity while seed and Series A stage company exits to IPO remained at 2% each.
In addition to providing a higher volume of exits, the IPO window also provided a substantial increase in value of exits. While M&A average values held steady over the ten years, IPO value increased from 6x the M&A value (2013-19) to nearly 14x the M&A value (2020-22).
2013-19: 95 $M average value per exit (M&A), 572 $M average value per exit via public listing.
2020-22: 99 $M average value per exit (M&A), 1376 $M average value per exit via public listing