
Craig Netterfield, our managing partner, reflects upon the fundraising environment - a comparative analysis of Venture Debt to Venture Capital. Our analysis also discusses how 2021 and 2022 has played out within the current funding climate.
When I founded CLP eight years ago, I thought the use of debt capital would continue to grow. During this very busy period that we at CLP are experiencing, we’ve taken some time to reflect upon the general trends of venture debt using a data analysis.
We’ve run an Early and Late Stage* comparative analysis of venture debt to venture capital funding as a percentage, in monetary value, from 2006 to date. *Typically, Pitchbook defines Early Stage as Series A/B and Late Stage as Series C/D.
Our analysis highlights a symbiotic relationship between debt and equity. This presents in patterns in the analysis that we ran. One trend that stands out is that during periods of tight funding, we see that debt is used a lot more. We saw that during the global financial crisis the adoption rate of debt capital increased. More recently with the retreat of the equity market we noted the effect in our analysis and how the venture debt market was affected more specifically during 2021 and 2022. Another trend that stands out is how debt has grown, taking up a larger portion of funding used by companies compared to venture capital.
Our analysis is represented in the graphs below.
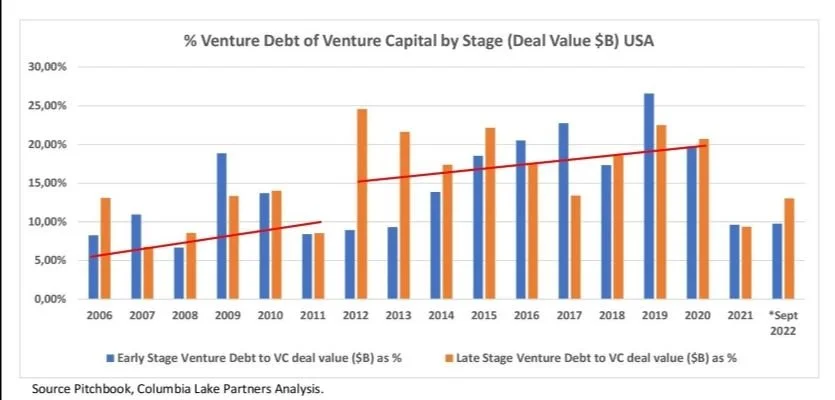
Looking at 2006 to 2010, we see a general increase in the use of debt. This period included the global financial crisis (mid-2007 to early-2009) when equity markets retreated. Companies were looking for alternative sources of capital, and as a result, venture debt became a more accepted financial instrument. In the graph above, we see this growth in the use of debt reflected during 2009 and 2010 in both the Early and Late Stages.
As debt helped companies navigate this difficult equity market, we see that from 2012 onwards, debt capital was more accepted as a funding source. Late Stage companies started using it consistently and Early Stage companies started adopting it at increasing levels until 2020.
When looking at the growth of debt capital, it tended to be more of a tiered step up over the following two timelines. The use of debt to equity as a capital source for companies during 2006 to 2011 was in the 5% to 10% range. This then increased to a range of 15% to 20% during 2012 to 2020.
The dynamic relationship playout between equity and debt capital showed up again in the more recent market dynamics of 2021 and how 2022 is unfolding.
Our analysis shows that in 2021 the use of venture debt dropped as a percentage of total financings. It was during 2021 that equity funding was at its most buoyant – and cheapest, characterized by high company valuations. As a result, we saw that debt was crowded out by the equity markets. In 2021, the use of venture debt retreated to the 2006 to 2011 range of 5% to 10%.
With the slowdown that happened in the equity market in 2022, compared with the buoyancy of 2021, we wait to see the impact on the venture debt market for the full year. However, as of September 2022, the use of venture debt as a percentage to venture capital had surpassed 2021 figures. Our quarterly analysis for 2022 reflects below that as at the end of September 2022 (Q3) the use of venture debt was back up to the 15% to 20% level – characteristic of the 2012 to 2020 range.
The data shows us that equity markets have retreated in 2022 and the use of debt has increased. Is this a case of companies taking debt when they can't raise equity? Our analysis would say "not at the moment" as both equity and debt funding levels appear to have reverted to 2018/2019 pre-COVID levels. So far, this feels like it could be a return to normal. Time will tell whether that is the case - we'll be tracking this.
In a follow-up feature in early 2023, we will continue with this analysis and reflect further on the venture debt trends.

Visit our Knowledge Centre for more information on Venture Debt or contact us to discuss your requirements.