
In this follow on feature, we continue with our comparative analysis of Venture Debt to Venture Capital. If you missed the first part, you can read it here.
What does the most recent data show us?
We see that while the use of debt capital has been consistent for several years. However the recent drop in venture equity funding has caused debt to appear as a higher percentage of total funding.
Our managing partner, Craig Netterfield, discusses this in more detail. Craig also discusses whether venture debt has been used as a substitute for equity.
With the slowdown that happened in the equity market in 2022, compared to the buoyancy of 2021, what was the impact on the venture debt market for the full 2022 year?
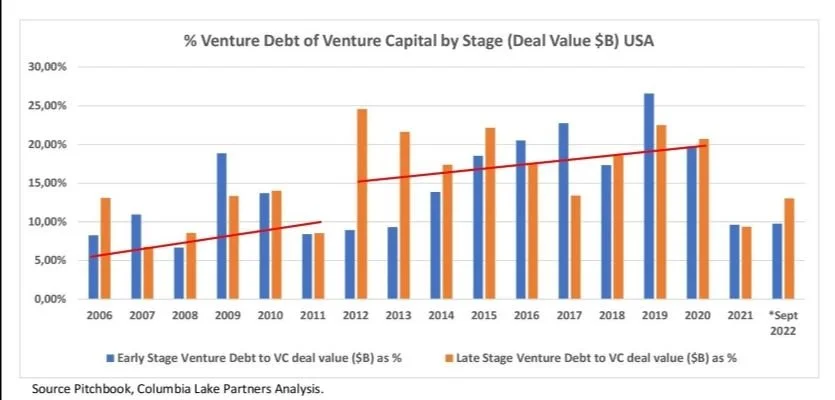
First some history – from 2012 to 2020 debt funding as a percentage of total funding for technology companies was typically between 15% and 20%.
In 2021 the buoyant equity markets saw use of venture debt as a percentage of total funding retreat to the 2006 to 2011 range of 5% to 10% for both Early and Late Stage companies. Mid-2022 saw the cycle revert to recent norms of 15% to 20.
In Q4 of 2022 we saw reduced equity fundings – and consistent debt fundings – which meant that debt capital as a percentage of total funding increased beyond this typical range for both Early (32.0%) and Late Stage (24.1%) companies. The aggregate for the 2022 year for Early Stage is 13.0% and Late Stage is 14.3% - reflected in our graph below.
At this stage, our updated analysis is once again indicating to us that equity and debt funding levels appear to be reverting to 2018/2019 pre-COVID levels.
Whilst the data shows us that equity markets retreated in 2022 compared to 2021 and that the use of debt as a percentage of venture capital funding increased, we ask:
Do we see companies taking on debt because they can’t raise equity in the current funding climate?
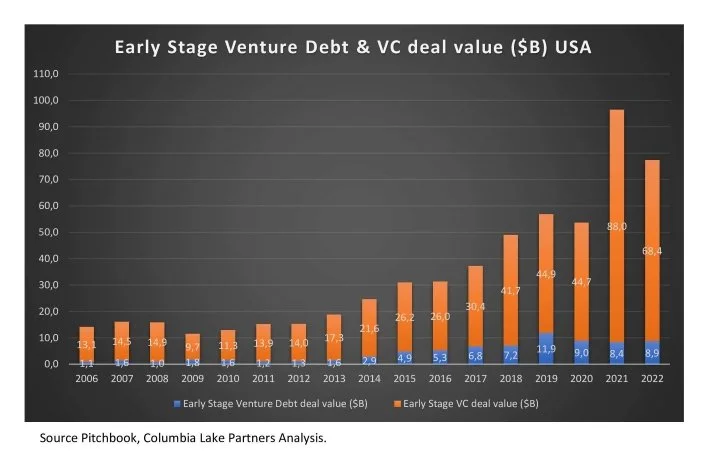
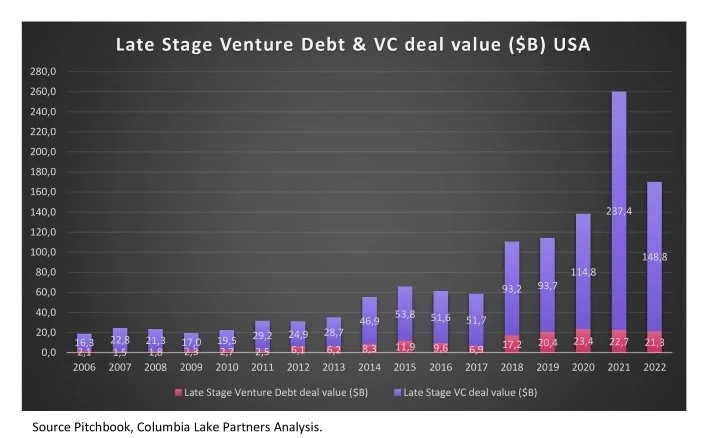
Our analysis indicates to us that, at the moment, this is not the case. We find that the use of debt by companies has been consistent over several years, in both the Early and Late Stages. From 2019 to 2022, the total of early and later-stage debt funding was approximately $31 billion per year.
On top of this is a fluctuating equity market that is absorbing the current macroeconomic factors playing out. This is evidenced in the timeline of this data from 2006 to 2022 as reflected in the graphs below.
When looking at this, let’s also keep in mind the following two aspects of firstly, the adoption of venture debt as a funding instrument at a specific timeframe. Secondly, the percentage of the use of debt equity to venture capital as a capital source.
A quick recap - 2006 to 2010, which included the global financial crisis (mid-2007 to early 2009). In this timeline, the use of debt to equity was in the 5% to 10% range. Adoption of the use of debt took place because of the financial crisis, which led to the use of debt moving into the 15% to 20% range from 2012 to 2020. Both aspects we discussed in more detail in our first feature.
We represent this data in the two graphs below for both the Early and Late Stages.
We will continue to track the data and share our updates with you.
* Our analysis uses source data from Pitchbook. We take note that after publishing our initial feature with our analysis, Pitchbook amended their definition of *Late Stage (which was typically Series C/D). The prior Late Stage is now split into two categories ‘Late Stage’ and Pitchbook’s newly created category ‘Venture Growth Stage’. This segment is defined as funding rounds Series E or later or financings involving companies that are at least seven years old and have raised at least six VC rounds. The sum of the data of ‘Late Stage’ and ‘Venture Growth Stage’ is the aggregate of what would have made up the prior Late Stage. For purposes of continuity of our feature we have worked with the aggregate data and thus retained the prior Late Stage definition.
Visit our Knowledge Centre for more information on Venture Debt or contact us to discuss your requirements.